Pourquoi des billes au hasard font toujours une courbe en cloche
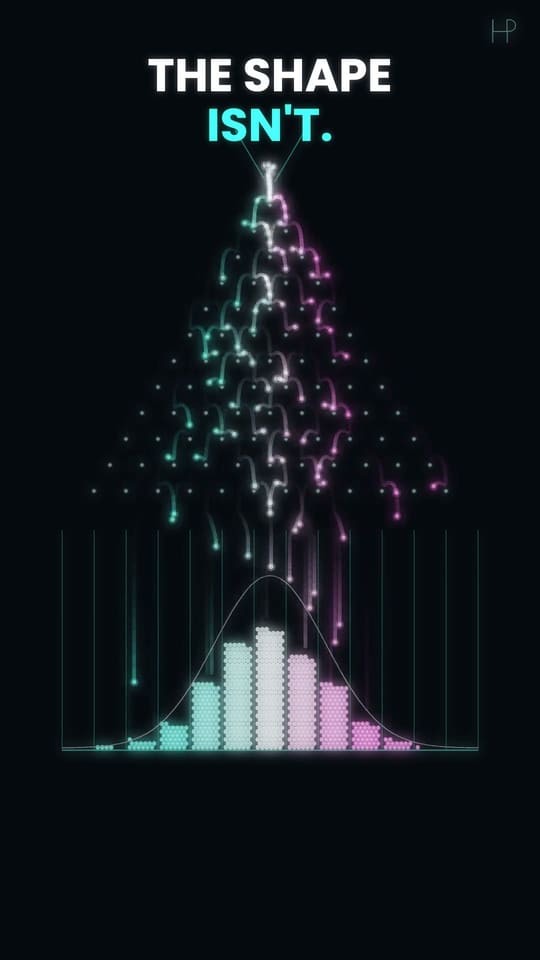
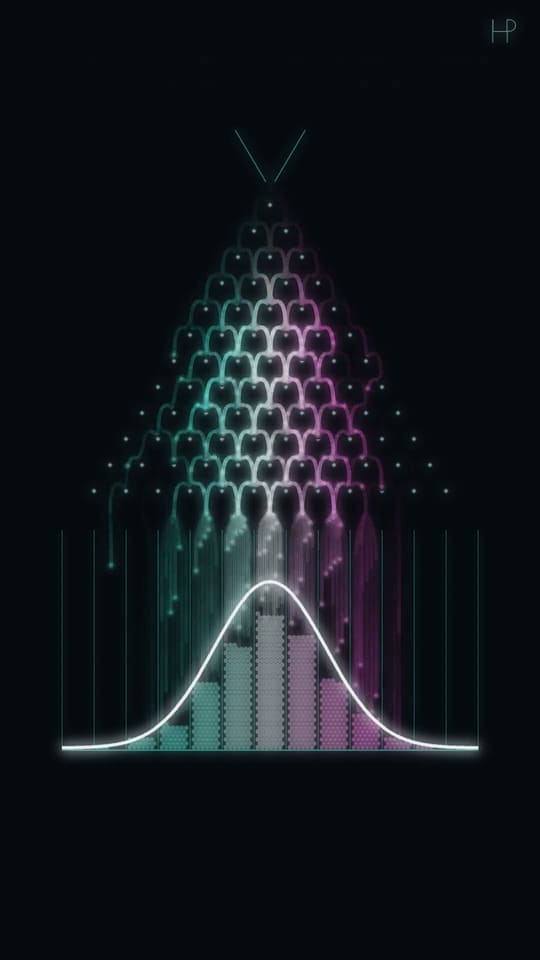
Chaque bille part à gauche ou à droite au hasard. Des milliers de billes dessinent pourtant toujours la même courbe en cloche.
Lecture depuis YouTube après un clic.
Essaie : change la règle
Lâche quelques billes. La courbe blanche montre où elles devraient s’accumuler.
Pourquoi ça marche
À chaque clou, une bille rebondit à gauche ou à droite au hasard. Une bille seule ne dit rien, mais des milliers s’empilent chaque fois en la même forme de cloche, parce qu’il y a beaucoup plus de chemins vers le milieu que vers les bords.
P(k) = C(n, k) · pᵏ · (1 − p)ⁿ⁻ᵏcentre = n·plargeur = √(n·p·(1 − p))
Construis-le toi-même
Python 3 · numpy · matplotlib5 000 billes à travers 12 rangées, leurs cases face à la courbe binomiale.
"""Galton board: every ball goes left or right at random at each of 12 rows of pegs.
Run: python galton-board.py   (needs: pip install numpy matplotlib)
"""
from math import comb

import numpy as np
import matplotlib.pyplot as plt

plt.style.use("dark_background")

rows, balls, p = 12, 5000, 0.5  # p: the chance of bouncing right
rng = np.random.default_rng()

bins = (rng.random((balls, rows)) < p).sum(axis=1)  # a ball's bin = how often it went right
counts = np.bincount(bins, minlength=rows + 1)

k = np.arange(rows + 1)
expected = [balls * comb(rows, i) * p**i * (1 - p) ** (rows - i) for i in k]  # the binomial curve

plt.figure(figsize=(7, 4))
plt.bar(k, counts, color="#5eead4", label="balls")
plt.xlabel("bin = times the ball went right")
plt.plot(k, expected, color="white", label="C(n, k) p^k (1-p)^(n-k)")
plt.legend()
plt.show()

# Try: p = 0.65 tilts the board; rows = 24 makes the bell narrower for its width
Essaie : Mets p = 0.65 pour pencher la planche, ou rows = 24 : la cloche se déplace, puis s’affine.
Apprends ce script ligne par ligne, avec des exercices et un quiz → · lance-le dans Google Colab (en anglais) →
Pour les enseignants : une fiche de cours de 45 minutes et une fiche d’exercices sur trois niveaux →
Les maths, telles que le film les raconte
Lire les notes du film (de YouTube, en anglais)
At each peg a ball goes left or right with equal chance, independently of everything before. After 12 rows its bin is simply the number of times it went right — 12 coin flips. There is exactly one route to the far-left bin (left, left, left… twelve times) out of 4,096 possible routes, but 924 different routes to the centre bin (any six lefts and six rights).
More routes means more balls, and the route counts are the numbers of Pascal's triangle: 1, 12, 66, 220, 495, 792, 924… Plotted, they form the binomial distribution, which for many flips becomes the normal "bell" curve — de Moivre found this in 1733, and Francis Galton built this board in 1876 to show it. In the second act every peg is rigged to send 65% of balls right: the bell does not break, it just moves to 12 × 0.65 = 7.8. In the third act each ball flips 24 coins instead of 12: relative to the board, the bell gets narrower, because the spread grows only with the square root of the number of flips.
The white curve is drawn before the balls arrive; every ball's route is a genuine random draw, and the run shown is one take chosen for how cleanly it fills the curve.
Colour is route: balls that went left more than expected are teal, right more than expected pink, right on target white.
D’après la description de Random Balls Build a Perfect Bell Curve (en anglais).