Dlaczego losowe kulki zawsze rysują krzywą dzwonową
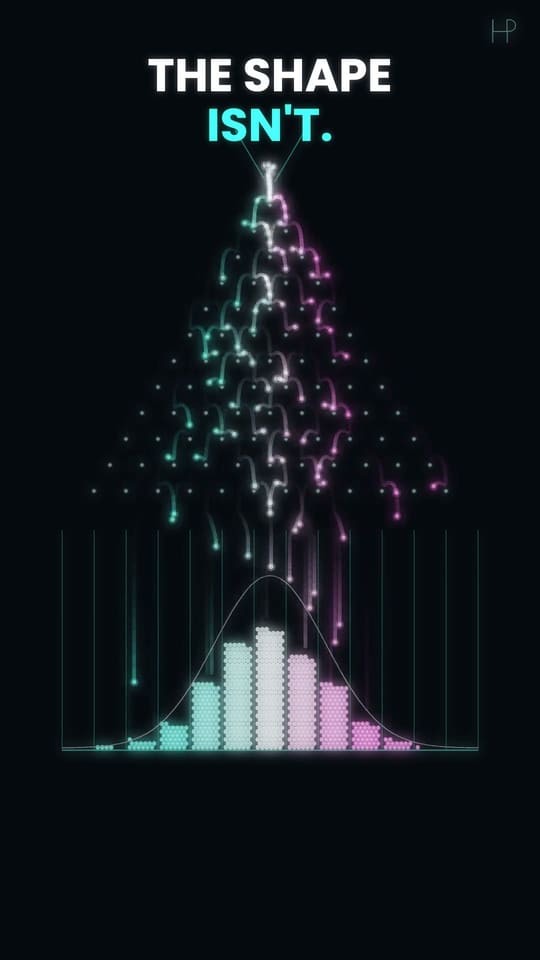
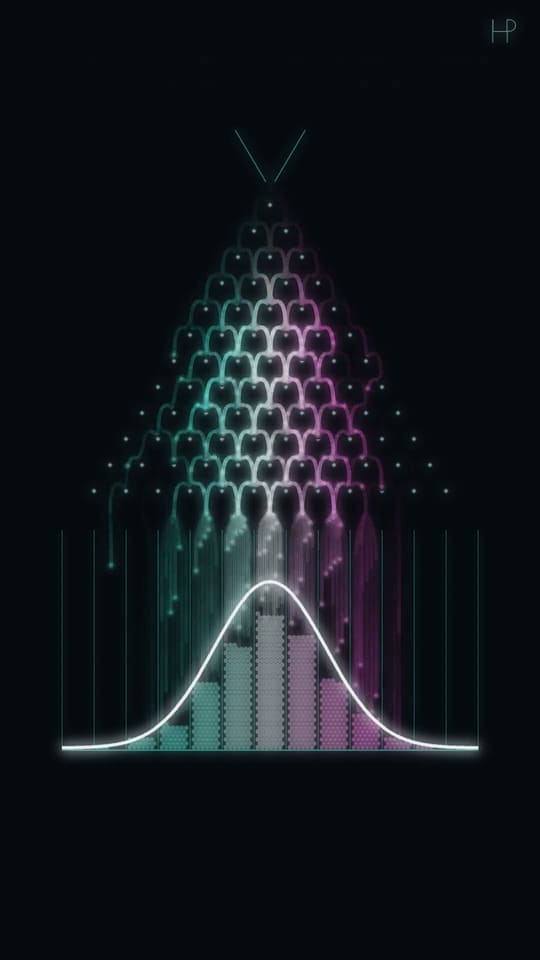
Każda kulka skręca w lewo albo w prawo przypadkiem. Tysiące kulek i tak rysują tę samą krzywą dzwonową.
Film gra z YouTube po kliknięciu.
Spróbuj: zmień regułę
Zrzuć kilka kulek. Biała krzywa pokazuje, gdzie powinny się zebrać.
Dlaczego to działa
Na każdym kołku kulka odbija się w lewo albo w prawo przypadkiem. Jedna kulka nic nie mówi, ale tysiące za każdym razem układają się w ten sam dzwon, bo do środka prowadzi o wiele więcej dróg niż do brzegów.
P(k) = C(n, k) · pᵏ · (1 − p)ⁿ⁻ᵏśrodek = n·prozrzut = √(n·p·(1 − p))
Zbuduj to w Pythonie
Python 3 · numpy · matplotlib5000 kulek przez 12 rzędów, ich przegródki na tle krzywej dwumianowej.
"""Galton board: every ball goes left or right at random at each of 12 rows of pegs.
Run: python galton-board.py   (needs: pip install numpy matplotlib)
"""
from math import comb

import numpy as np
import matplotlib.pyplot as plt

plt.style.use("dark_background")

rows, balls, p = 12, 5000, 0.5  # p: the chance of bouncing right
rng = np.random.default_rng()

bins = (rng.random((balls, rows)) < p).sum(axis=1)  # a ball's bin = how often it went right
counts = np.bincount(bins, minlength=rows + 1)

k = np.arange(rows + 1)
expected = [balls * comb(rows, i) * p**i * (1 - p) ** (rows - i) for i in k]  # the binomial curve

plt.figure(figsize=(7, 4))
plt.bar(k, counts, color="#5eead4", label="balls")
plt.xlabel("bin = times the ball went right")
plt.plot(k, expected, color="white", label="C(n, k) p^k (1-p)^(n-k)")
plt.legend()
plt.show()

# Try: p = 0.65 tilts the board; rows = 24 makes the bell narrower for its width
Spróbuj: Ustaw p = 0.65, żeby przechylić deskę, albo rows = 24: dzwon się przesuwa, potem zwęża.
Poznaj ten skrypt linijka po linijce, z zadaniami i quizem → · uruchom go w Google Colab (po angielsku) →
Dla nauczycieli: karta lekcji na 45 minut i karta pracy na trzech poziomach →
Matematyka tak, jak opowiada ją film
Pokaż notatki z filmu (z YouTube, po angielsku)
At each peg a ball goes left or right with equal chance, independently of everything before. After 12 rows its bin is simply the number of times it went right — 12 coin flips. There is exactly one route to the far-left bin (left, left, left… twelve times) out of 4,096 possible routes, but 924 different routes to the centre bin (any six lefts and six rights).
More routes means more balls, and the route counts are the numbers of Pascal's triangle: 1, 12, 66, 220, 495, 792, 924… Plotted, they form the binomial distribution, which for many flips becomes the normal "bell" curve — de Moivre found this in 1733, and Francis Galton built this board in 1876 to show it. In the second act every peg is rigged to send 65% of balls right: the bell does not break, it just moves to 12 × 0.65 = 7.8. In the third act each ball flips 24 coins instead of 12: relative to the board, the bell gets narrower, because the spread grows only with the square root of the number of flips.
The white curve is drawn before the balls arrive; every ball's route is a genuine random draw, and the run shown is one take chosen for how cleanly it fills the curve.
Colour is route: balls that went left more than expected are teal, right more than expected pink, right on target white.
Z opisu filmu Random Balls Build a Perfect Bell Curve (po angielsku).