でたらめな玉が、なぜいつも釣鐘形の曲線になるのか
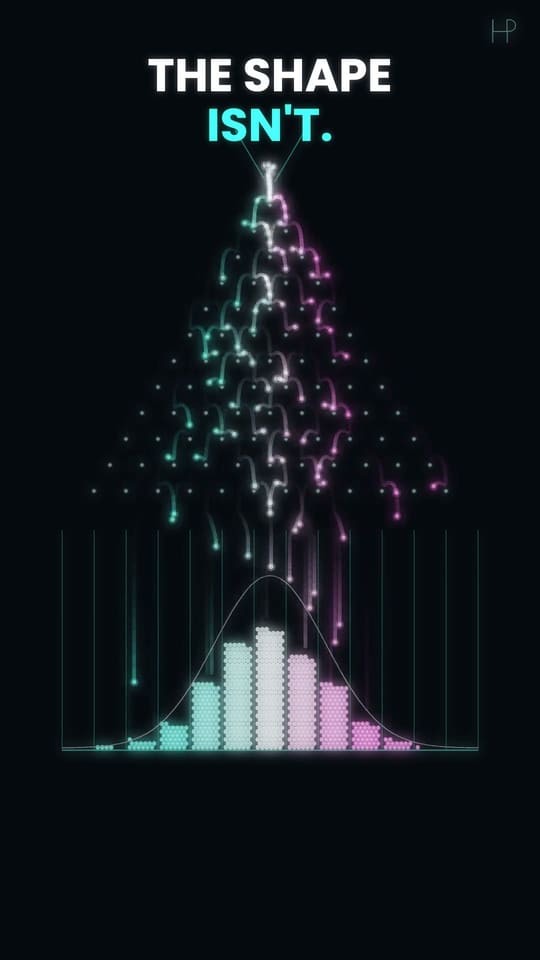
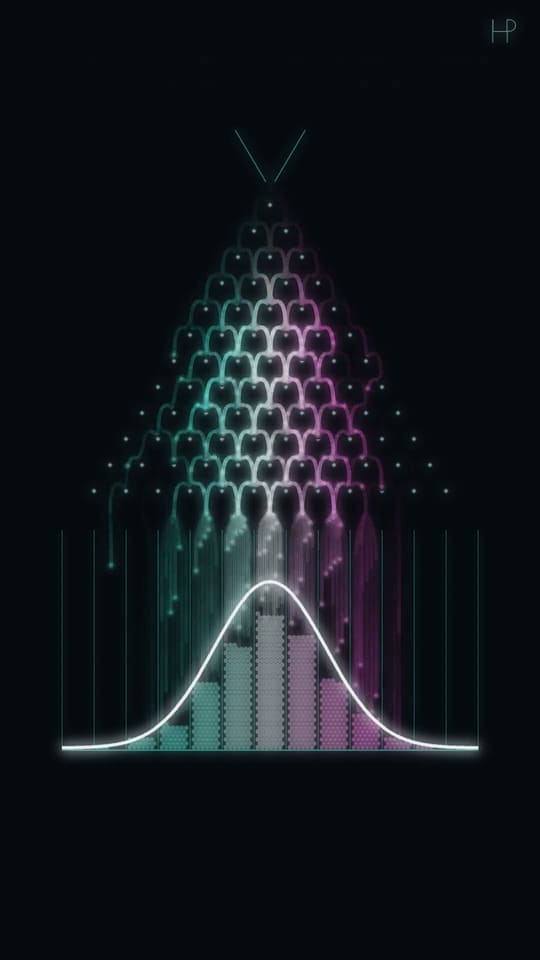
どの玉も、でたらめに左か右へ進みます。それでも何千個もの玉は、毎回同じ釣鐘形の曲線を描きます。
クリックするとYouTubeから再生されます。
試してみよう:ルールを変える
玉をいくつか落としてみてください。白い曲線は、玉がどこに積もるはずかを示しています。
なぜそうなるのか
くぎに当たるたびに、玉はでたらめに左か右へ跳ねます。玉1個では何もわかりませんが、何千個も集まると、毎回同じ釣鐘の形に積もります。端よりも真ん中にたどり着く道のほうが、ずっと多いからです。
P(k) = C(n, k) · pᵏ · (1 − p)ⁿ⁻ᵏ中心 = n·p広がり = √(n·p·(1 − p))
自分で作る
Python 3 · numpy · matplotlib玉5,000個が12段を通り抜け、入った箱を二項分布の曲線と比べます。
"""Galton board: every ball goes left or right at random at each of 12 rows of pegs.
Run: python galton-board.py   (needs: pip install numpy matplotlib)
"""
from math import comb

import numpy as np
import matplotlib.pyplot as plt

plt.style.use("dark_background")

rows, balls, p = 12, 5000, 0.5  # p: the chance of bouncing right
rng = np.random.default_rng()

bins = (rng.random((balls, rows)) < p).sum(axis=1)  # a ball's bin = how often it went right
counts = np.bincount(bins, minlength=rows + 1)

k = np.arange(rows + 1)
expected = [balls * comb(rows, i) * p**i * (1 - p) ** (rows - i) for i in k]  # the binomial curve

plt.figure(figsize=(7, 4))
plt.bar(k, counts, color="#5eead4", label="balls")
plt.xlabel("bin = times the ball went right")
plt.plot(k, expected, color="white", label="C(n, k) p^k (1-p)^(n-k)")
plt.legend()
plt.show()

# Try: p = 0.65 tilts the board; rows = 24 makes the bell narrower for its width
試してみよう: p = 0.65 にしてボードを傾けるか、rows = 24 にしてみましょう。釣鐘は動き、それから細くなります。
このスクリプトを1行ずつ、練習問題とクイズで学ぶ → · Google Colabで実行(英語) →
先生向け: 45分の授業カードと3段階のワークシート →
動画が語る数学
動画の解説を読む(YouTubeより、英語)
At each peg a ball goes left or right with equal chance, independently of everything before. After 12 rows its bin is simply the number of times it went right — 12 coin flips. There is exactly one route to the far-left bin (left, left, left… twelve times) out of 4,096 possible routes, but 924 different routes to the centre bin (any six lefts and six rights).
More routes means more balls, and the route counts are the numbers of Pascal's triangle: 1, 12, 66, 220, 495, 792, 924… Plotted, they form the binomial distribution, which for many flips becomes the normal "bell" curve — de Moivre found this in 1733, and Francis Galton built this board in 1876 to show it. In the second act every peg is rigged to send 65% of balls right: the bell does not break, it just moves to 12 × 0.65 = 7.8. In the third act each ball flips 24 coins instead of 12: relative to the board, the bell gets narrower, because the spread grows only with the square root of the number of flips.
The white curve is drawn before the balls arrive; every ball's route is a genuine random draw, and the run shown is one take chosen for how cleanly it fills the curve.
Colour is route: balls that went left more than expected are teal, right more than expected pink, right on target white.
次の動画の説明より: Galton Board: 1,140 Random Balls Draw a Perfect Bell Curve(英語).