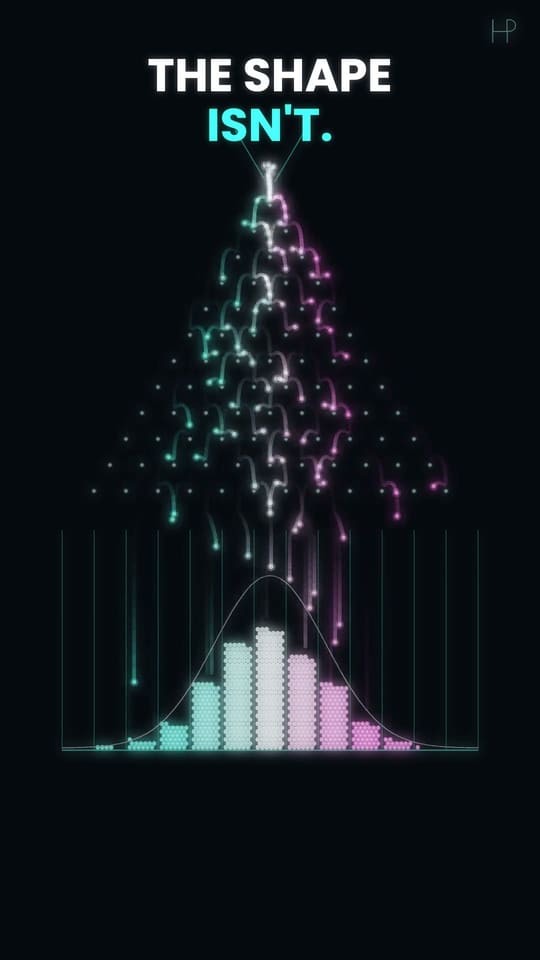
무작위로 떨어지는 공은 왜 언제나 종 모양 곡선을 만들까
공은 하나하나 무작위로 왼쪽이나 오른쪽으로 가요. 그래도 수천 개가 모이면 언제나 같은 종 모양 곡선을 그려요.
클릭하면 YouTube에서 재생돼요.
해 보기: 규칙을 바꿔 보세요
공을 몇 개 떨어뜨려 보세요. 흰 곡선은 공이 쌓여야 할 자리를 보여 줘요.
왜 이렇게 될까
공은 못마다 무작위로 왼쪽이나 오른쪽으로 튀어요. 공 하나로는 아무것도 알 수 없지만, 수천 개를 떨어뜨리면 매번 같은 종 모양으로 쌓여요. 가장자리보다 가운데로 가는 길이 훨씬 많기 때문이에요.
P(k) = C(n, k) · pᵏ · (1 − p)ⁿ⁻ᵏ중심 = n·p퍼짐 = √(n·p·(1 − p))
직접 만들기
Python 3 · numpy · matplotlib공 5,000개가 12줄을 지나 쌓인 칸을 이항분포 곡선과 비교.
"""Galton board: every ball goes left or right at random at each of 12 rows of pegs.
Run: python galton-board.py   (needs: pip install numpy matplotlib)
"""
from math import comb

import numpy as np
import matplotlib.pyplot as plt

plt.style.use("dark_background")

rows, balls, p = 12, 5000, 0.5  # p: the chance of bouncing right
rng = np.random.default_rng()

bins = (rng.random((balls, rows)) < p).sum(axis=1)  # a ball's bin = how often it went right
counts = np.bincount(bins, minlength=rows + 1)

k = np.arange(rows + 1)
expected = [balls * comb(rows, i) * p**i * (1 - p) ** (rows - i) for i in k]  # the binomial curve

plt.figure(figsize=(7, 4))
plt.bar(k, counts, color="#5eead4", label="balls")
plt.xlabel("bin = times the ball went right")
plt.plot(k, expected, color="white", label="C(n, k) p^k (1-p)^(n-k)")
plt.legend()
plt.show()

# Try: p = 0.65 tilts the board; rows = 24 makes the bell narrower for its width
해 보기: p = 0.65로 바꿔 보드를 기울이거나 rows = 24로 바꿔 보세요. 종이 움직이고, 그다음 좁아져요.
이 스크립트를 한 줄씩, 연습 문제와 퀴즈로 배우기 → · Google Colab에서 실행 (영어) →
선생님을 위해: 45분 수업 지도안과 3단계 활동지 →
영상이 들려주는 수학
영상 노트 보기 (YouTube에서, 영어)
At each peg a ball goes left or right with equal chance, independently of everything before. After 12 rows its bin is simply the number of times it went right — 12 coin flips. There is exactly one route to the far-left bin (left, left, left… twelve times) out of 4,096 possible routes, but 924 different routes to the centre bin (any six lefts and six rights).
More routes means more balls, and the route counts are the numbers of Pascal's triangle: 1, 12, 66, 220, 495, 792, 924… Plotted, they form the binomial distribution, which for many flips becomes the normal "bell" curve — de Moivre found this in 1733, and Francis Galton built this board in 1876 to show it. In the second act every peg is rigged to send 65% of balls right: the bell does not break, it just moves to 12 × 0.65 = 7.8. In the third act each ball flips 24 coins instead of 12: relative to the board, the bell gets narrower, because the spread grows only with the square root of the number of flips.
The white curve is drawn before the balls arrive; every ball's route is a genuine random draw, and the run shown is one take chosen for how cleanly it fills the curve.
Colour is route: balls that went left more than expected are teal, right more than expected pink, right on target white.
출처: 다음 영상의 설명 Galton Board: 1,140 Random Balls Draw a Perfect Bell Curve (영어).