24本の振り子は、なぜずれて、またそろうのか
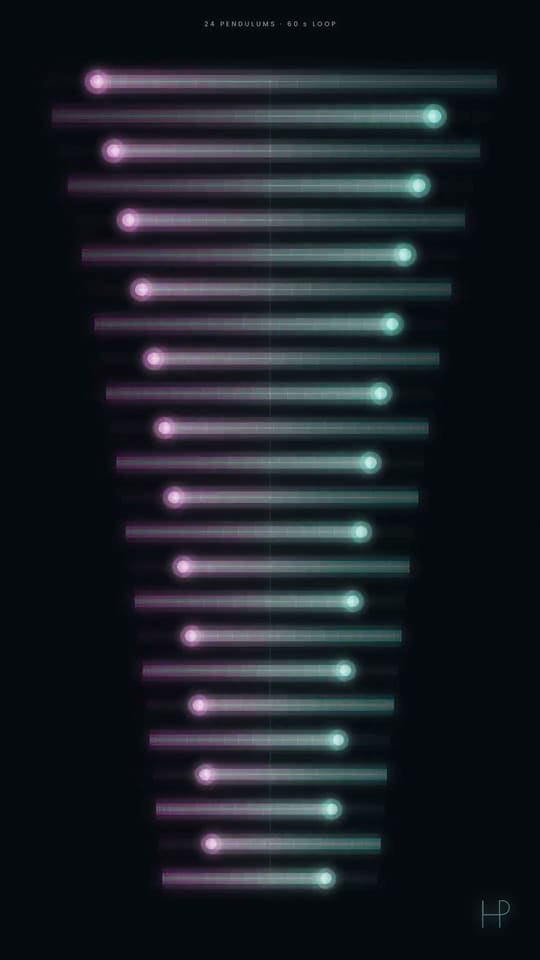
長さが少しずつ違う振り子が、だんだんずれて波を描き、また一列にそろいます。
クリックするとYouTubeから再生されます。
試してみよう:ルールを変える
4.0秒:となり同士が1往復の4.0/60ずれていて、列が波を描きます。
なぜそうなるのか
どの振り子も、ひとつ前より少し短いので、少し速く揺れます。いっしょに放すと、だんだんずれて波やヘビのような形、一見カオスのような姿になり、ちょうど1分後には、また全部がそろいます。
Tₙ = 60 s ÷ nLₙ = g · (Tₙ ÷ 2π)²n = 51, 52, … 74
自分で作る
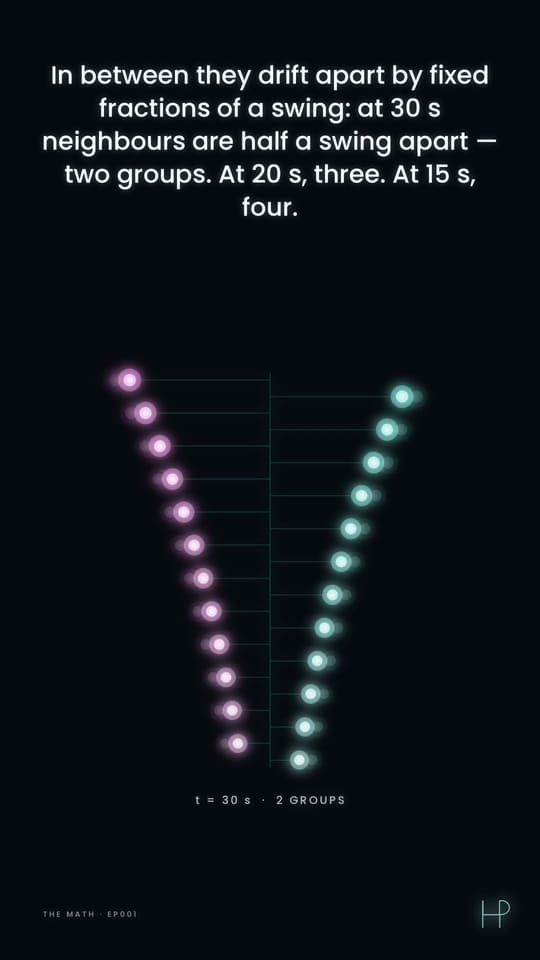
Python 3 · numpy · matplotlib0、15、20、30秒の時点での24個のおもりの列と、その長さ。
"""Pendulum wave: 24 pendulums making 51, 52, ... 74 swings in 60 seconds.
Run: python pendulum-wave.py   (needs: pip install numpy matplotlib)
"""
import numpy as np
import matplotlib.pyplot as plt

plt.style.use("dark_background")

g, cycle = 9.81, 60.0  # gravity in m/s^2, seconds until they are back in step
n = np.arange(51, 75)  # swings per cycle, one more for each pendulum
period = cycle / n
length = g * (period / (2 * np.pi)) ** 2  # small swings: T = 2 pi sqrt(L / g)
print("lengths in cm:", np.round(length * 100, 1))

fig, axes = plt.subplots(1, 4, figsize=(12, 4), sharey=True)
for ax, t in zip(axes, [0, 15, 20, 30]):
    swing = np.cos(2 * np.pi * t / period)  # where each bob is, from -1 to 1
    ax.scatter(swing, np.arange(len(n)), c=swing, cmap="cool", s=40)
    ax.set_title(f"t = {t} s")
    ax.set_xlim(-1.2, 1.2)
    ax.axis("off")
plt.show()

# Try: t = 60 s (or 75, 80, 90): the same pictures again, as every count is whole
試してみよう: 時刻に60を足してみましょう。列は、最初と同じように一列に戻ります。
動画が語る数学
動画の解説を読む(YouTubeより、英語)
Each of the 24 pendulums is slightly shorter than the one before it, tuned so that in one minute the longest completes exactly 51 swings, the next 52, and so on up to 74. Because every count is a whole number, all 24 arrive back at their starting point together at the 60-second mark — perfectly in step. In between, the row drifts apart by fixed fractions of a swing: at 30 s neighbours differ by half a cycle, so odd and even pendulums are exactly opposite (that is the moment the colours split into two groups); at 20 s they form three groups, at 15 s four, and so on.
The travelling "snake" you see is nothing more than those small fractions adding up along the row. The lengths come from the exact period of a real pendulum, T = 4·√(L/g)·K(sin²(θ₀/2)), with K the complete elliptic integral, and the animation integrates the full non-linear equation of motion rather than the small-angle approximation — so the 60-second return is exact, not approximate. Colour is position: teal on one side of centre, pink on the other, white as a bob crosses the middle at full speed.
The second minute shows the very same motion while the camera rises to a bird's-eye view.
次の動画の説明より: Pendulum Wave: 24 Pendulums Fall Out of Sync, Then Snap Back(英語).